Gallery 3 - ArcGIS 3D Visualization
The following screen captures show various examples of cave and karst 3D GIS mapping and visualization. The descriptions include details on data sources and techniques used to create the images.
Click the thumbnail to view a larger image. All maps and images by: B. W.Szukalski.
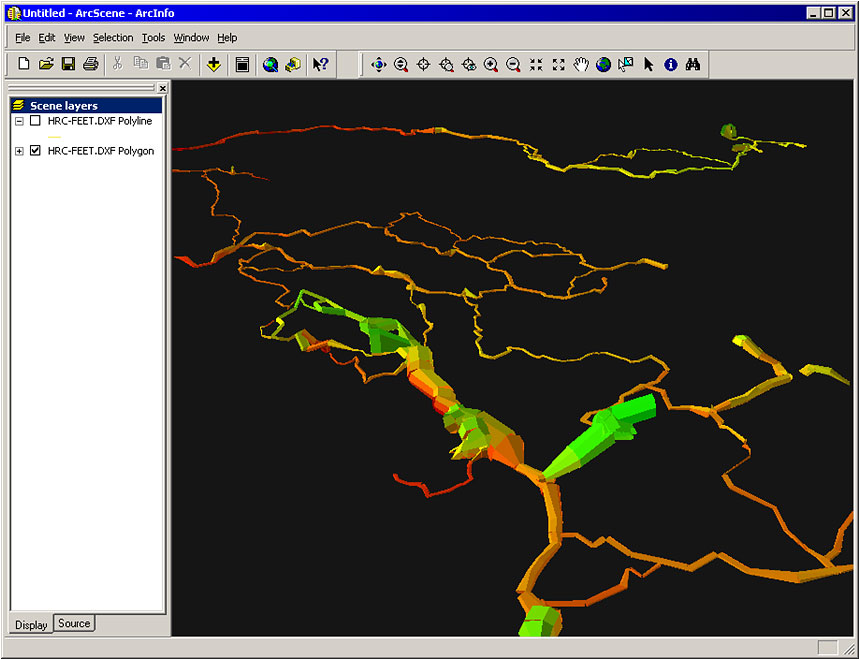
HIDDEN RIVER CAVE 3D MODEL
The Hidden River Cave survey data has been georeferenced and exported to DXF format using Compass cave survey software. Using ArcGIS the cave passage is symbolized and is shown here in ArcScene, a component of the ArcGIS 3D Analyst.
The model has been created using Compass to generate a representation of the cave using the passage dimensions obtained during the survey of the cave and recorded for each survey station.
At the time this data was created DXF files were one of the few alternatives available to create a map like this. Today an equivalent map could more easily have been made by choosing to export from Compass to 3D shapefile format, one of several export formats that Compass now supports. Also note that in general when working with CAD files that DWG is the preferred format over DXF.
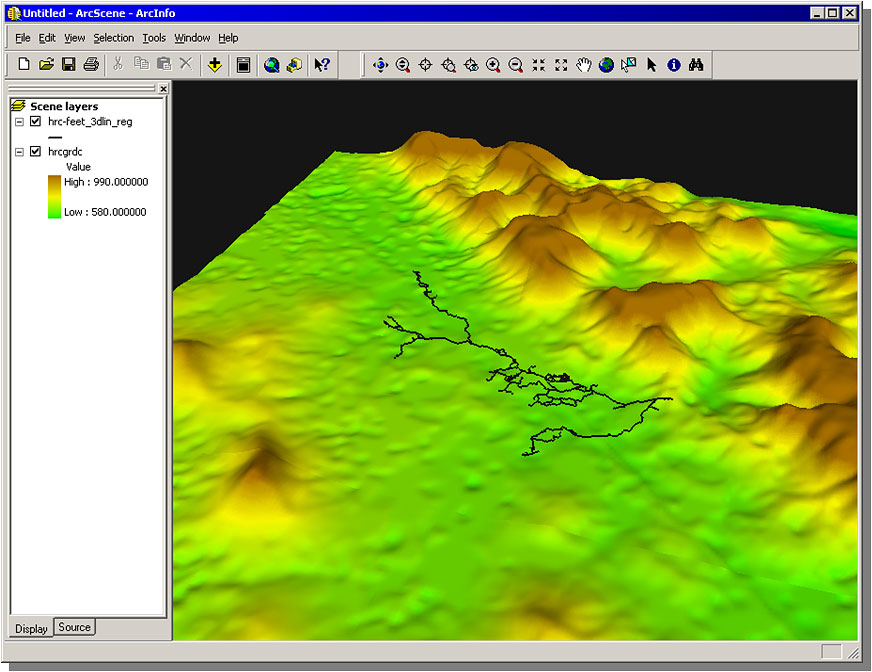
HIDDEN RIVER CAVE SURFACE DRAPE
Here the Compass cave survey data was converted to shapefile format using CaveTools, a now legacy Compass to GIS conversion program that was authored by myself and offered as an extension to ArcView 3.0. CaveTools is no longer needed to convert Compass cave survey data to shapefile format since Compass now supports direct export to 2D and 3D shapefiles and other formats.
The surface was created from a USGS DEM of the area, shaded, and displayed in 3D using ArcScene.
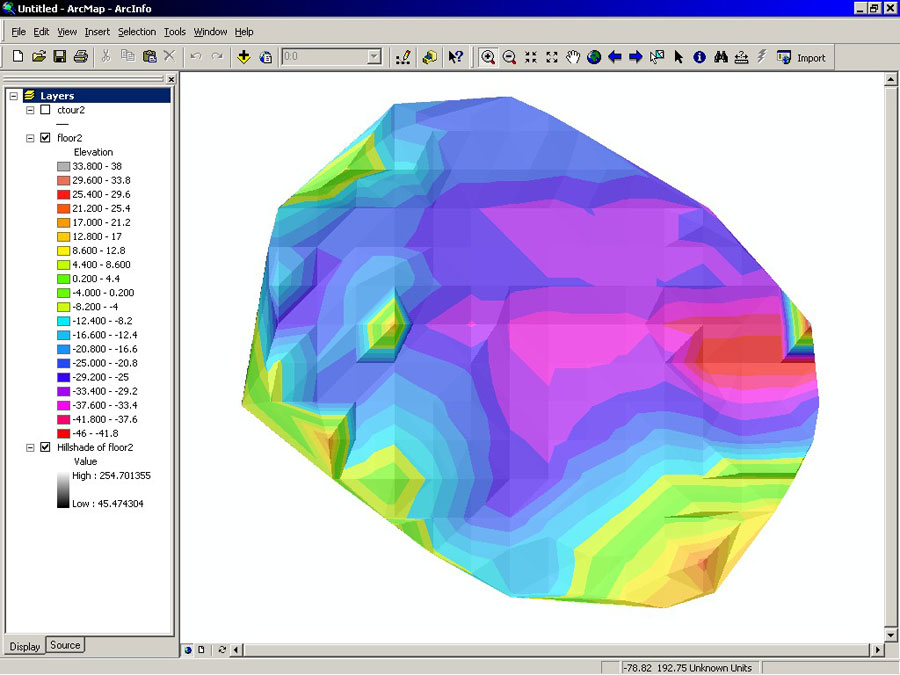
MAJLIS AL JINN FLOOR ELEVATION
Cavers visiting Majlis Al Jinn (Oman) extablished a grid on the cave floor and surveyed to each intersection point in the grid. The elevation values from the survey were used to construct a Triangular Irregular Network (TIN) and elevation model. A hillshade was generated from the elvation model, and draped using partial transparency. The floor is viewed here using ArcView 3.x and ArcScene. Additional grid points could have been used to create a more accurate surface. Surface generalization tools (neighborhood mean, etc.) could also have been used to smooth the floor. The visualization was originally prepared for a National Geographic article covering an expedition to Oman that included a visit to the cave, however the article was never published. Data courtesy: Dr. Louise Hose.
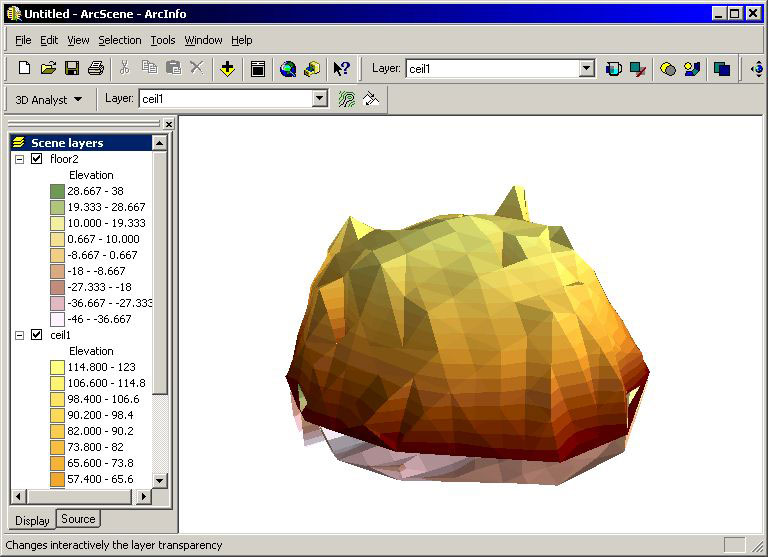
MAJLIS AL JINN 3D CHAMBER
The entrance chamber of Majlis Al Jinn is truly impressive, almost 300 meters wide. The grid used above to measure the floor elevation was also used to take ceiling heights (at the time using a helium ballon) at each grid point. A TIN of the ceiling elevations was created from the balloon measurements, and an elevation grid was created from the ceiling heights. The ceiling surface is shown atop the floor from the example above, and is viewed here using ArcView 3.x and ArcScene.