Linking and Managing Inventory and Other Data in ArcGIS
ArcGIS can be used to manage the data collected about caves and karst features and can be used to manage detailed cave inventory information including photos, reports, and data from real-time sensors and other devices. A GIS database can be implemented to store and manage both small scale (regional) as well as large scale (one cave) data. There are many different approaches that can be taken to accomplish the desired results, and not all involve a GIS (scroll down to see the last example on this page).
If using a GIS to manage inventory data and other assets about a particular cave there are two basic approaches. One is to georeference the cave data to actual real world coordinate space and use GIS tools to attributize features (and also perform spatial query and analysis on those features). This can be done with georeferenced raster maps or vector data as discussed in other sections, and offers the capability to produce continuous small scale to large scale multi-resolution data layers. But often this approach is cumbersome to develop and difficult maintain over the long run, and the physical dimensions of the cave in relation to the resolution of other GIS layers may not merit this approach.
Another approach is to keep the map or vector survey data in "page space" rather than real world coordinate space, and simply add or digitize GIS features for storage, management, and query of the data. Though not in a real world coordinate location, the cave data can be transformed into actual scale (feet or meter units) for measurement and GIS analysis. This technique provides similar data management functions and capabilities as creating georeferenced cave data, but provides a streamlined and easily maintainable workflow.
The method of choice will depend on the desired results and the requirements of the ultimate implementation, as well as the ability to sustain the implementation over time. The following screenshots present an overview of some options.
Click the thumbnail to view a larger image. All maps and images by: B. W. Szukalski.
CAVE LOCATIONS AND ATTRIBUTES
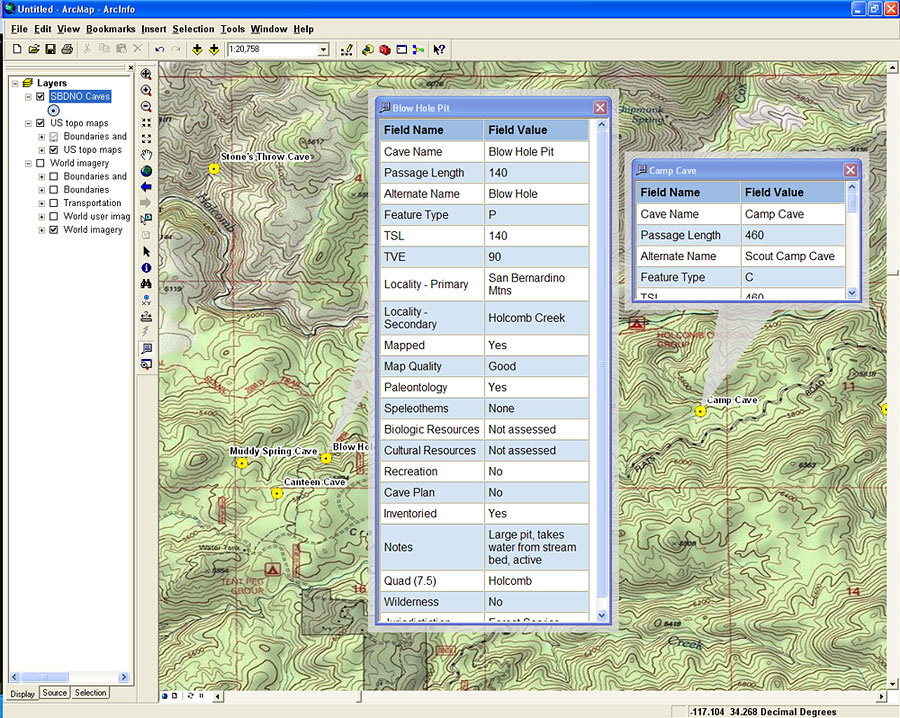
In this example cave locations are stored as point features in a geodatabase, with the feature attributes containing basic cave information. The attributes can also include links to cave maps and other content (photos, reports, etc.). Here the attributes are displayed using an HTML popup whose appearance can be controlled using a style sheet. The cave locations in this map are bogus, but the inventory fields are from a database in use by cave resources staff at a national park.
CAVE SURVEY DATA AND ATTRIBUTES
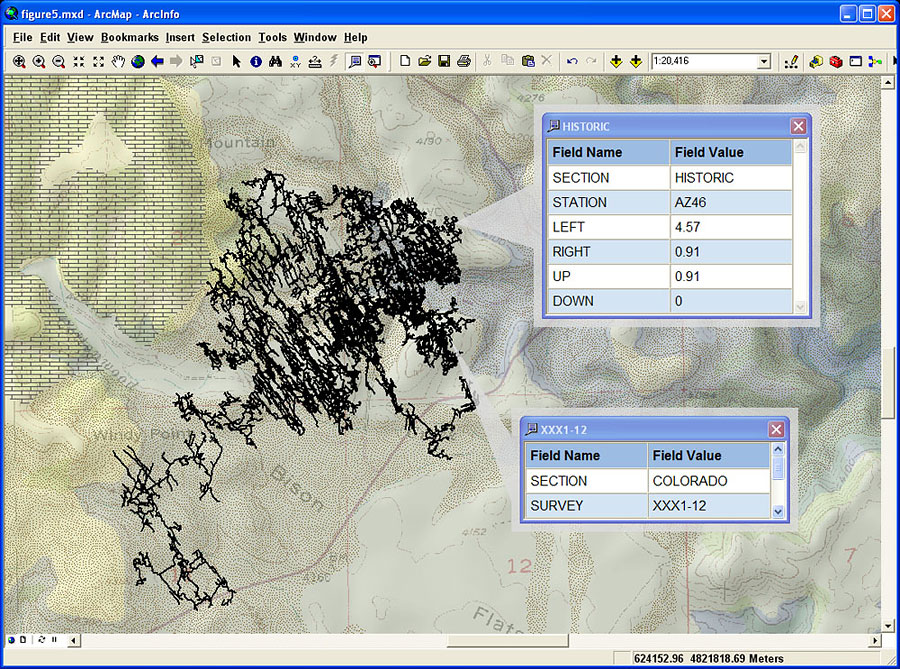
Cave survey lines and stations have been exported as georeferenced shapefiles using Compass. The Compass attributes (including LRUDs for stations, survey name and section for survey lines) is preserved in the output. Most in-cave inventories use either the survey lines or more commonly the stations to record inventory data. These attributes can be appended to the attributes already existing for the survey lines and stations, and can also include links to the actual inventory documents, photos, or reports.
GEOREFERENCED CAVE SURVEY DATA AND LINKED DOCUMENTS
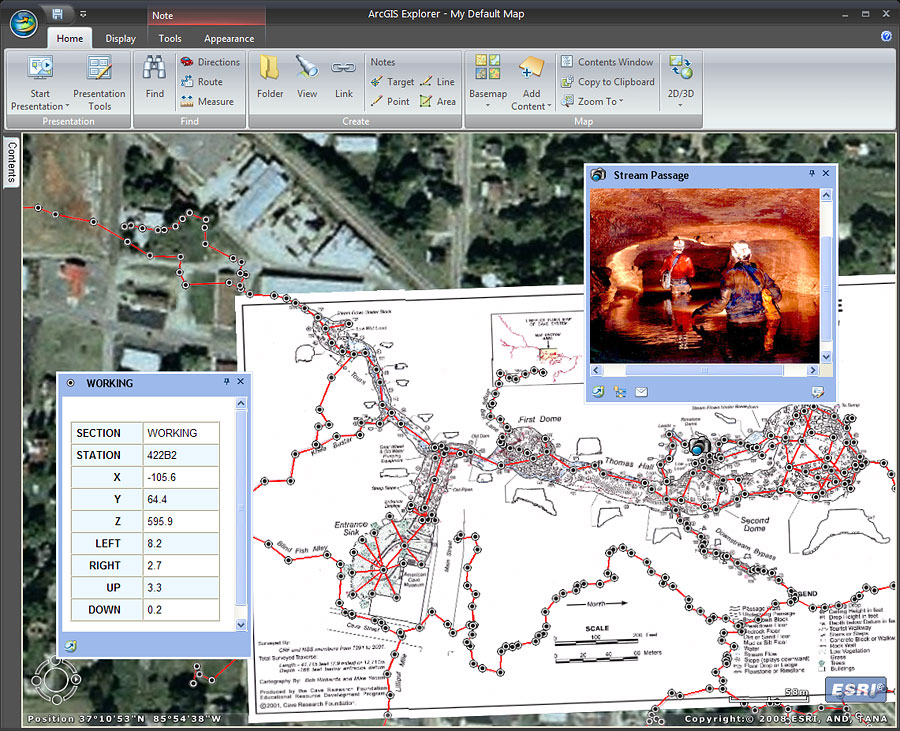
Other cave data, such as locations of photos that have been taken in the cave, can be added as a separate GIS feature layers with the cave map and survey data. Links to photos and other documents can be opened as popups when clicked. The same technique can be used to add additional inventory data that can include reports and other documents, or links to spreadsheets and tables pertaining to the inventory. In this example everything is georeferenced and in UTM coordinate space. However the same can be achieved without georeferencing the the entire map and associated data. This can be accomplished by digitizing or exporting feature layers from the source maps, or simply using the source maps as a backdrop to geodatabase features. See the example below.
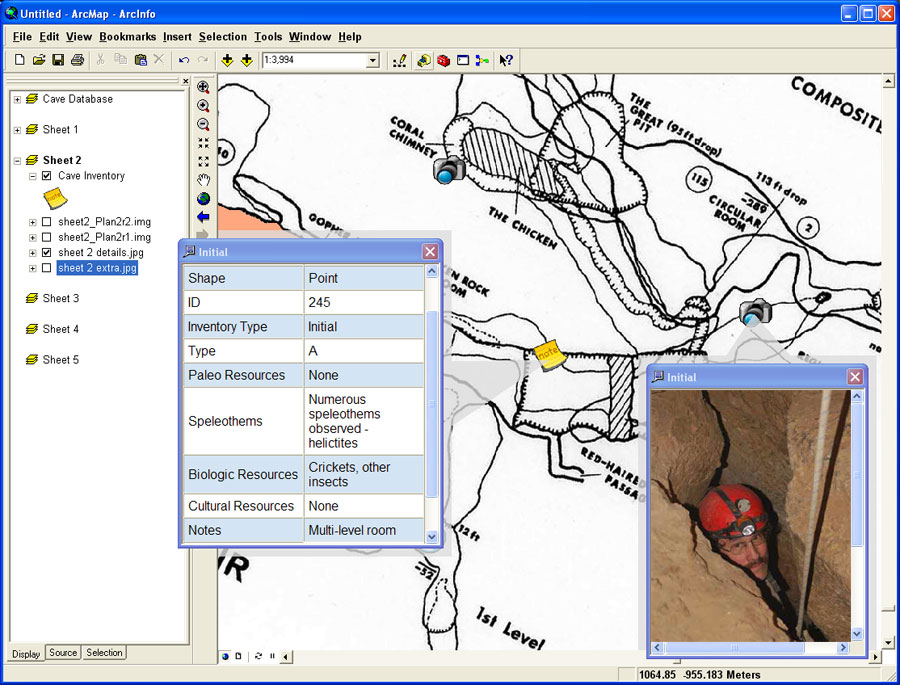
NON-GEOREFERENCED CAVE MAP AND GIS ATTRIBUTES
The cave map shown here has been scanned and added to ArcMap as a layer, and is in non-georeferenced page space. The map has been rotated so that north in the drawing is up. Though not in a real-world coordinate system, GIS feature layers can be added to the map, attributized, and managed using GIS tools. Here inventory information and photographs have been added and stored as point features in a geodatabase. Optionally the passage outline can be digitized or vectorized from the scanned map.
Another option to scanning or vectorizing is to use the hardcopy cave map to digitize features. Other features can be added using ArcGIS once the passage outlines and other desired information have been digitized from the paper maps. A good example of this technique can be found in The Use of GIS in the Spatial Analysis of an Archaeological Cave Site (H. A. Moyes, 2002).
(Note: there is ongoing software development work at ESRI that will facilitate workflows using non-georeferenced scanned maps - E-mail for additional information.)
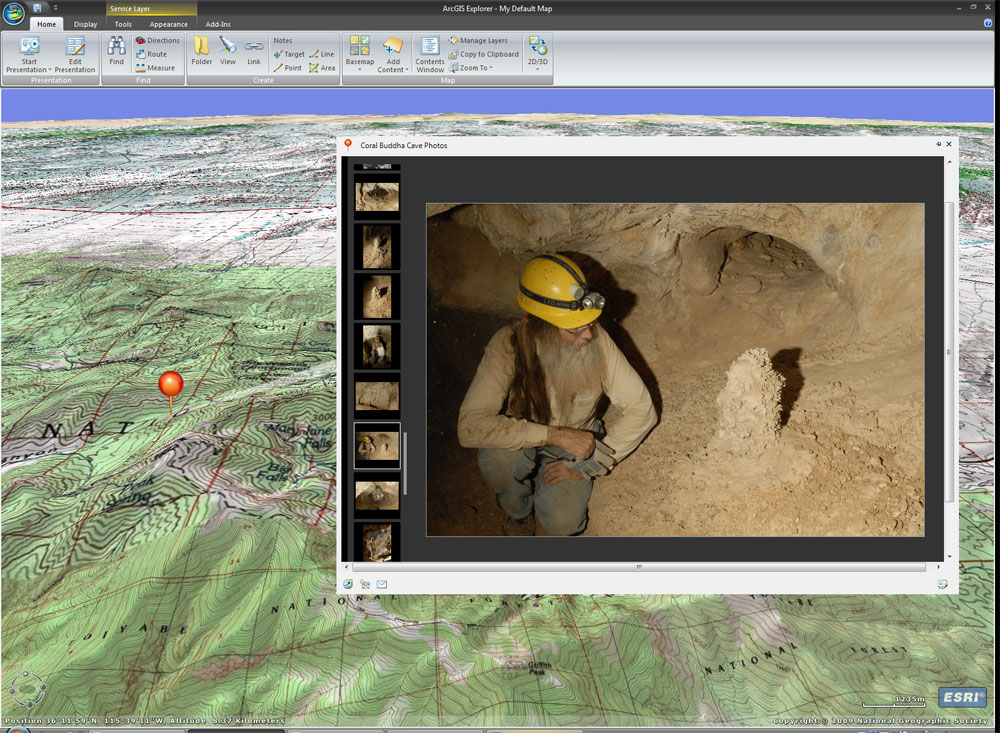
ONE-TO-MANY PHOTOS
Photos are often the classic example of multiple bits information that need to be managed for a single location - a cave, along a portion of a survey, etc. Here's an easy way that doesn't require a complex GIS schema or document management system. Adopt a standardized way of organizing all your photos, and leverage HTML documents and popups to link in your many photos to their one location. Here's an example of where we've implemented a flash-based viewer that allows the user to browse multiple photographs of the cave that are all linked to a single location - the cave entrance point feature.
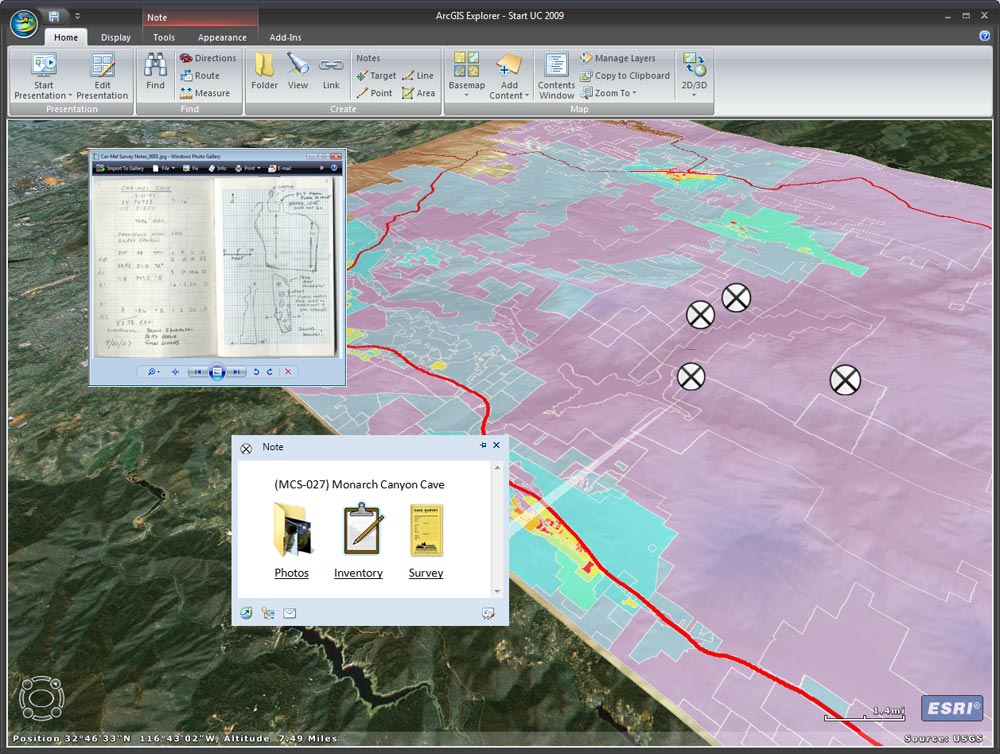
MANY ONE-TO-MANY DOCUMENTS
Need to manage multiple document types in one-to-many relationships? In this example the storage of all the documents (scanned survey notebook pages, photos, inventory sheets) a single cave have been stored in a standard folder hierarchy within the project. Adopting a standard way of organizing these documents facilitates using an HTML page in popups as the gateway to viewing the multiple documents that have been associated with a single feature in the GIS, in this case the point feature location of the cave entrance.
The popup window displays the HTML document, and clicking on the desired document type opens a new window with the document, which can exist in a one-to-many relationship to the cave location (see example above). Here's the popup window lets us choose from viewing photos, the inventory sheets, or the scanned survey notes for the cave. The survey notes option was clicked in the popup window, opening the scanned notes in a new window seen above the popup.
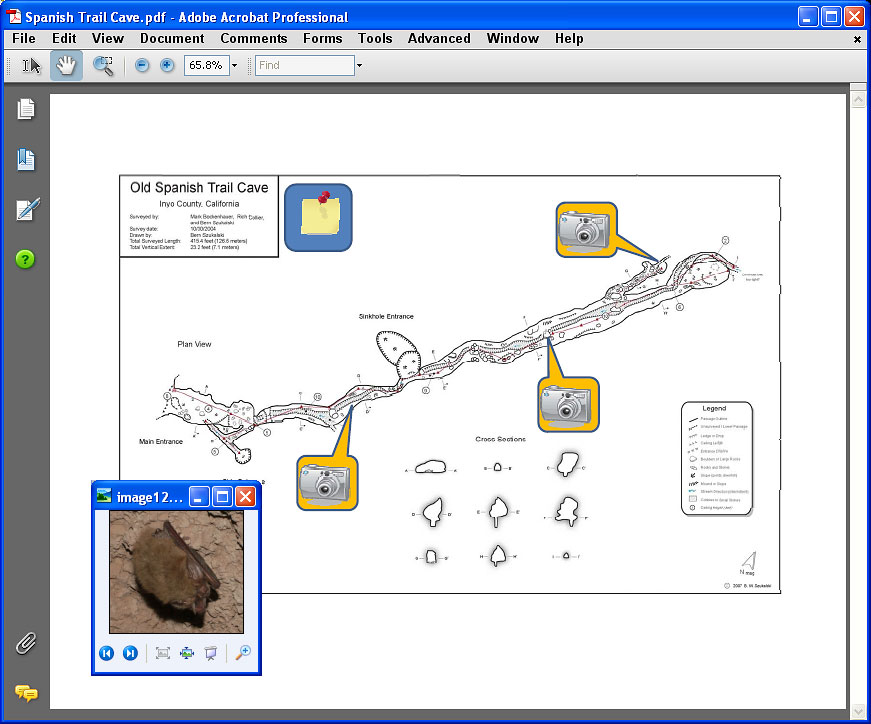
MANAGING ATTRIBUTES WITHOUT GIS
There's lots of reasons to manage your cave data in a GIS, and some reasons not to. Here's an example of taking the simple approach to linking inventory data and photos using a Microsoft Office document saved as a PDF file. In this implementation, clicking the camera callouts opens a photo taken at that location in the cave. Clicking the note in the blue box next to the title opens the inventory sheet for the cave. The same document could be used in a Web page.